Your political view's here please ..

Collapse
X
 
  • Time
  • Show
Clear All
new posts
  • truthwolf1
    Member
    • Oct 2008
    • 2696

    #121
    Originally posted by Zimobog
    What do those images mean to you guys? I'm just curious what that speaks to there.
    The image speaks on very many levels but I thought it was a good related visual for the list that I placed.

    Actually I believe that a little blubber on people is actually good for them verses having a starved and ripped body.

    The Morbid obesity that is portrayed in the image seems to me to be more about large numbers in our society that have completely given up on many different fronts.

    Comment

    • Zimobog
      Member
      • Jan 2013
      • 585

      #122
      Thanks for answering that Truthwolf1. I, too, think the 1950s might have been better than today for a few reasons. The biggest reason being that what is called "government" was so much more limited in size and scope during the 50s.

      What affect has subsidization of food had on obesity? This is most evident among those recieving "food stamps". What do people buy when someone else is paying for it?

      Comment

      • lxskllr
        Member
        • Sep 2007
        • 13435

        #123
        Originally posted by Zimobog
        What do those images mean to you guys? I'm just curious what that speaks to there.
        To me the image is just a snapshot of two different times, and I have to fill in my own knowledge for the rest.

        Old = American made, people walked around, and businesses were owned by your neighbors.

        New = Chinese made, people drive everywhere, and business are /managed/ by your neighbors.

        Comment

        • Zimobog
          Member
          • Jan 2013
          • 585

          #124
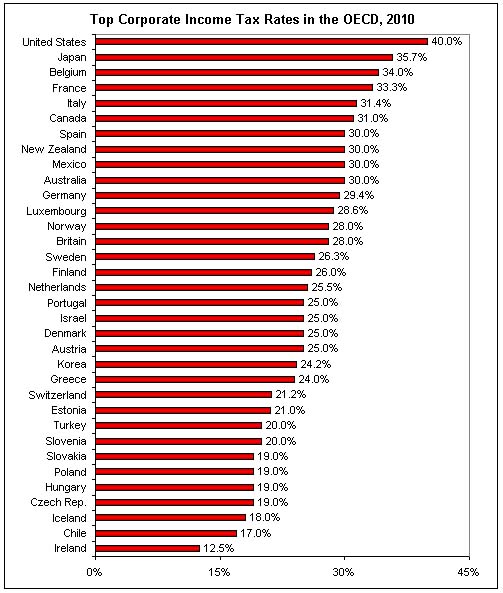
          lxskllr, thanks for your take on that. I wonder what effect the figures on this 2010 graph might mean for the US manufacturing and business:


          Comment

          • Zimobog
            Member
            • Jan 2013
            • 585

            #125
            That is a graph for the 30 most wealthy nations. The same year as this graph, Japan lowered it's own rate by 10%. You remember when everything was "Made in Japan"? They followed the US example (raised their rates) until alot of their production went "overseas" as well.

            The ctr in China is 25% vs. in the US where it is 40%+.
            In the US, governement spending is 42% of GDP, in China government spending is 23.6% of GDP. Wait, I thought they were the Communists???
            Russia has a flat income tax rate of 13% and a corporate rate of 20%. Wait, I thought they were the Communists???

            Comment

            • Zimobog
              Member
              • Jan 2013
              • 585

              #126
              Take the World's Smallest Political Quiz:
              http://www.theadvocates.org/quiz
              Click image for larger version

Name:	image.jpg
Views:	1
Size:	44.9 KB
ID:	597732

              Comment

              • lxskllr
                Member
                • Sep 2007
                • 13435

                #127
                Originally posted by Zimobog
                Take the World's Smallest Political Quiz:
                http://www.theadvocates.org/quiz
                [ATTACH=CONFIG]2995[/ATTACH]
                100% on everything :^D

                Comment

                • Zimobog
                  Member
                  • Jan 2013
                  • 585

                  #128
                  ^well done, lxskllr! A perfect score (in my opinion of course ).

                  Comment

                  Related Topics

                  Collapse

                  Working...
                  X